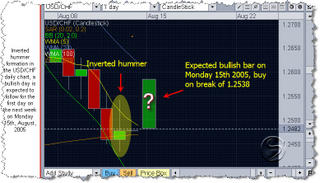
Inverted hummer formation in the USD/CHF daily chart, a bullish day is expected to follow for the first day on the next week on Monday 15th, August, 2005
Expected bullish bar on Monday 15th 2005, buy on break of 1.2538
Sharing forex thoughts.

Posted by
Forexenator
at
8/13/2005 02:08:00 PM
0
comments
![]()
Posted by
Forexenator
at
8/13/2005 02:01:00 PM
0
comments
![]()

Posted by
Forexenator
at
8/13/2005 01:44:00 PM
0
comments
![]()
The hammer is a bullish reversal pattern that forms after a decline. In addition to a potential trend reversal, hammers can mark bottoms or support levels. After a decline, hammers signal a bullish revival. The low of the long lower shadow implies that sellers drove prices lower during the session. However, the strong finish indicates that buyers regained their footing to end the session on a strong note. While this may seem enough to act on, hammers require further bullish confirmation. The low of the hammer shows that plenty of sellers remain. Further buying pressure, and preferably on expanding volume, is needed before acting. Such confirmation could come from a gap up or long white candlestick. Hammers are similar to selling climaxes and heavy volume can serve to reinforce the validity of the reversal.
The hanging man is a bearish reversal pattern that can also mark a top or resistance level. Forming after an advance, a hanging man signals that selling pressure is starting to increase. The low of the long lower shadow confirms that sellers pushed prices lower during the session. Even though the bulls regained their footing and drove prices higher by the finish, the appearance of selling pressure raises the yellow flag. As with the hammer, a hanging man requires bearish confirmation before action. Such confirmation can come as a gap down or long black candlestick on heavy volume.
Posted by
Forexenator
at
8/13/2005 01:09:00 PM
0
comments
![]()

Posted by
Forexenator
at
8/09/2005 05:30:00 PM
1 comments
![]()