Monday, August 15, 2005

USD/CHF daily chart


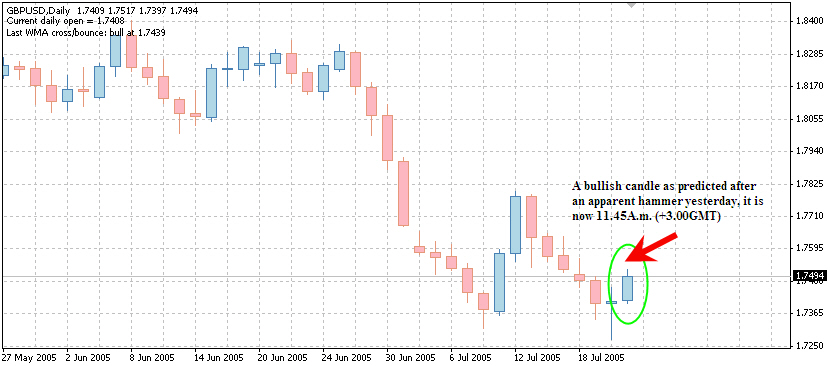
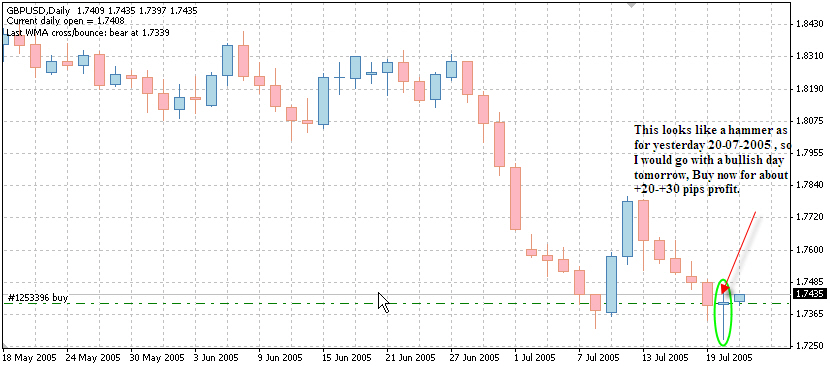
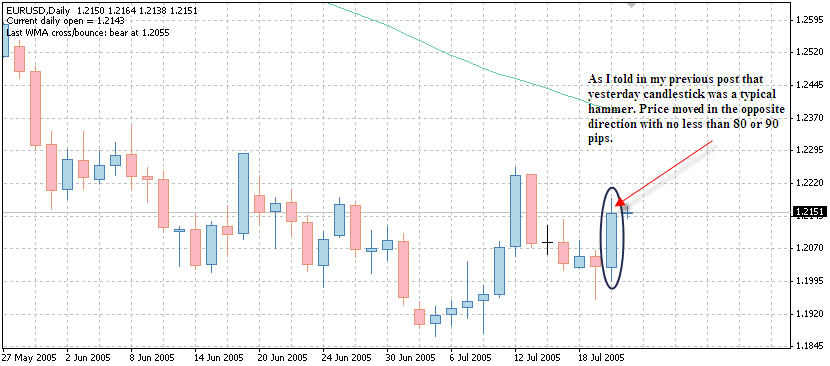
Actual bullish bar that is formed today compared to the suggested one in the previous post

Inverted hammer in the USD/CHF confirmed

Inverted Hammer in Friday's trading day, Now confirmed and followed a long bullish candle.

Hanging man confirmed in the EUR/USD chart


It was a hanging man , and a long bear candle met today's trading for the EUR/USD pair.

Saturday, August 13, 2005

Inverted hummer formation in the USD/CHF daily chart


Inverted hummer formation in the USD/CHF daily chart, a bullish day is expected to follow for the first day on the next week on Monday 15th, August, 2005


Expected bullish bar on Monday 15th 2005, buy on break of 1.2538

Inverted Hammer


A small real body at the lower end of a long upper shadow. It warns of a potential bottom reversal in a falling market.

Hanging man formation in the EUR/USD daily chart


Hanging man formation in the EUR/USD daily chart, a bearish day is expected to follow on Monday 15th August when the market opens.

Hammer and Hanging Man in Candlesticks formations patterns


The first pair, hammer and hanging man, are identical with small bodies and long lower shadows. The second pair, shooting star and inverted hammer, are also identical with small bodies and long upper shadows. Only preceding price action and further confirmation determine the bullish or bearish nature of these candlesticks. The hammer and inverted hammer form after a decline and are bullish reversal patterns, while the shooting star and hanging man form after an advance and are bearish reversal patterns.

The hammer and hanging man look exactly alike, but have different implications based on the preceding price action. Both have small real bodies (black or white), long lower shadows and short or non-existent upper shadows. As with most single and double candlestick formations, the hammer and hanging man require confirmation before action.

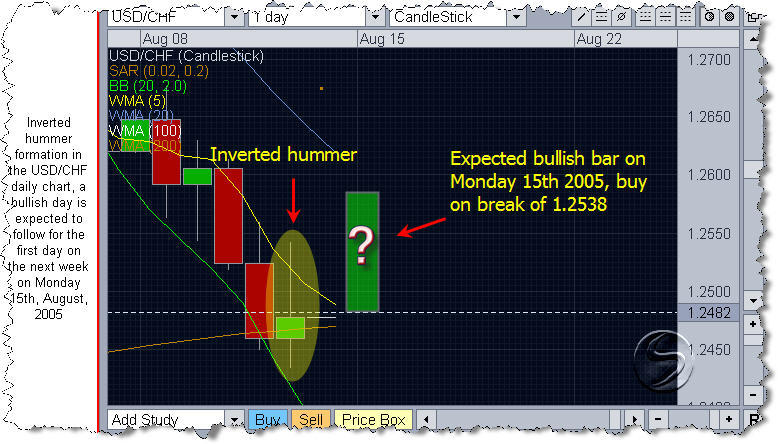
The hammer is a bullish reversal pattern that forms after a decline. In addition to a potential trend reversal, hammers can mark bottoms or support levels. After a decline, hammers signal a bullish revival. The low of the long lower shadow implies that sellers drove prices lower during the session. However, the strong finish indicates that buyers regained their footing to end the session on a strong note. While this may seem enough to act on, hammers require further bullish confirmation. The low of the hammer shows that plenty of sellers remain. Further buying pressure, and preferably on expanding volume, is needed before acting. Such confirmation could come from a gap up or long white candlestick. Hammers are similar to selling climaxes and heavy volume can serve to reinforce the validity of the reversal.

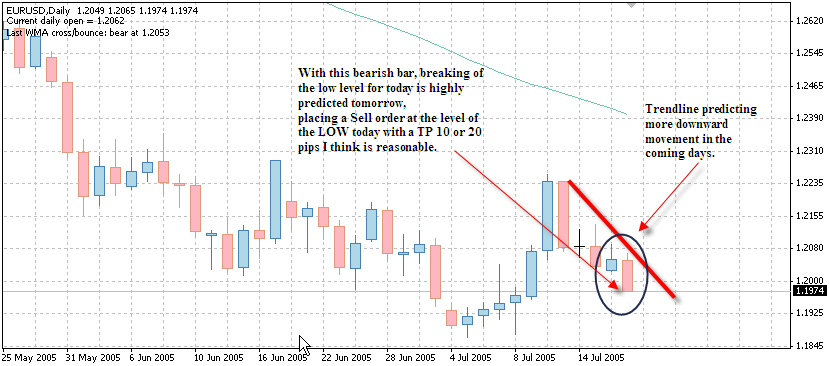
The hanging man is a bearish reversal pattern that can also mark a top or resistance level. Forming after an advance, a hanging man signals that selling pressure is starting to increase. The low of the long lower shadow confirms that sellers pushed prices lower during the session. Even though the bulls regained their footing and drove prices higher by the finish, the appearance of selling pressure raises the yellow flag. As with the hammer, a hanging man requires bearish confirmation before action. Such confirmation can come as a gap down or long black candlestick on heavy volume.

Tuesday, August 09, 2005


Hummer formation here, buy on break of 1.2626 for 10-50 pips profit, depending upon your exit strategy.

Thursday, August 04, 2005


EUR/USD broke the 1.2343 level shooting up to 1.2380 level, triggering the order at 1.2343 and getting 37 pips there, of course I just got a few of these pips :) but lucky who got more.

Wednesday, August 03, 2005


EUR/USD broke the 1.2171 support today reaching 1.2146, then it went up like a rocket to break the 1.2250 resistance which was the powerfull resistance he didn't break easily, but after that the EUR/USD reached 1.2343. Orders at this level for buying EUR/USD @ 1.2343 for a 10-20 pips profit.


The EUR/USD descended down to 1.2150 in the Asian session as was predicted in the previous post, collecting about from 20-50 ips depending about exit strategies. Now the pair mey a strong support at 1.2150 reversing the direction to reach 1.2206 at the time I am writing this comment. Oanda FxTrade platform is at 12.00EST, so everyday starts at 12.00 EST, (-7 GMT)


GBP/USD order was executed at 1.7670 for +10 pips profit although the pair extended the bearish movement to 1.7651, Now the pair met a strong support there as what happened in the EUR/USD pair.

Tuesday, August 02, 2005


Double top sign, which is a trend reversal sign in the EUR/USD daily chart. Sell at 1.2171 for 20-50 pips profit. For brave traders out there, you can sell from now for a 50 pips profit.


Sorry for the spelling mistakes, The correction is : Possible spining top on the GBP/USD daily chart at Oanda FXtrade platform. I think tomorrow is facing a bearish day for the GBP and it will be confirmed after the GBP interest rate announcement. Look for selling at 1.7670 for 10-30 pips profit.


Possible spining top on the GBP/USD daily chart at Oanda FXtrade platform. I think tomorrow is faccing a bearisg day for the GBP and it will be confirmed after the GBP interest rate announcement. Look for selling at 1.7670 for 10-30 pips profit.


A hammer is formed on the CHF/USD daily chart at Oanda FXtrade platfoirm, which adds to the confirmation that tomorrow will be a USD bulls day, look for buy at 1.2801 for 20-50 pips profit depending upon your exit strategy.

The EUR/USD failed to break the 1.2250 again!


The Eur/$ pair failed to break the 1.2250 again, will it break it in the next few days?

Monday, August 01, 2005

EUR/USD didn't break the 1.2250 resistance level today.


EUR failed to break the 1.2250 today, if the price moved lower today in the bears side, then a shooting star will be formed paving the way for a further down movement of the EURO.

Open Trades at Oanda as of 11.30 EST


Open Trades in Oanda as of 11.30 Est, prices may face some more retracement during the remaining hours of this day.

EUR/USD did make a retrace for 60 pips.

In my previous post today , 20-30 pips retracement in the EUR/USD was predicted, now the pair met a big retracement to 1.2181 level, triggering a sell signal on the bunny cross , but I am still out of the market for now.


3 Pip spread on GBP/USD pair, on Oanda FXtrade platform, Oanda never stops amazing me, I hope they settle this 3 pips spread as a premenant spread on this pair.


prices in the EUR/USD will retrace for while here , I predict it will retrace for about 20-30 pips.


prices in the EUR/USD will retrace for while here , I predict it will retrace for about 20-30 pips.


The EUR/USD did break the 1.2158 Hi level of the previous day, breaking with it the expectations of a stronger $ today, now the next resistance for the EUR/$ pair is 1.2250, if the Euro succeeded in breaking this level then further upmove is predicted.

Saturday, July 30, 2005

Economic Calender for Monday 1 August, 2005

Friday, July 29, 2005


Possible spinning top here, so look for a reversal if the EUR/USD didn't break the 1.2158 Hi for today

Thursday, July 28, 2005


Today was a reliefing day for the order which was executed two days ago and went down -100 pips, now today if anyone was having the guts , the order went to +120 pips, of course I didn't wait that long and I closed the trade at about +11 pips.


It was indeed a bullish engulfing pattern yesterday in the EUR/USD , Congratulation for all who gathered +20 pips and more.

Exit GBP/USD trade at +11 pips

Exit GBP/USD trade at +11 pips

Set your stop loss to 1.7474

Hi All the GBP/USD trade is now +15 ips, please set your stop loss to +0 pips @ 1.7474 and wait for te price to move.
Now any one can just close the trade when he think he got the pips that satisfy him, because the trade may turn against us and the net profit will be zero.
Have a nice time.

Wednesday, July 27, 2005

Bullish Engulfing Pattern


A chart pattern that forms when a small black candlestick is followed by a large white candlestick that completely eclipses or "engulfs" the previous day's candlestick. The shadows or tails of the small candlestick are short, which enables the body of the large candlestick to cover the entire candlestick from the previous day.


As implied in its name, this trend suggests that the bulls have taken control of a security’s price movement from the bears. This type of pattern usually accompanies a declining trend in a security, suggesting that a low or end to a security's decline has occurred. However, as usual in candlestick analysis, the trader must take the preceding and following days' prices into account before making any decisions regarding the security.

Is this a bullish engulfing pattern? I think so.

GBP/USD order placed yesterday

GBP/USD order placed yesterday is now at -8 pips instead of -100 pips. I will be watching the market to adjust exactly when to exit the trade. right now look for +20-+30 pips profit.

Tuesday, July 26, 2005


Unfortunately the order was made in the GBP/USD pair but the pair moved in the opposite direction quickly and stayed there all the day to end up with a bearish candle. I am still on the Long side in GBP/USD, -100 pips for now.


EUR/USD was beyond my expectations but Thanks God the order was not executed so there is +0 pips as for the EUR/USD, I will remain away as for now . Always remember that having no position is a position.

Monday, July 25, 2005

Buy GBP/USD @1.7472 TP +20 pips

Buy GBP/USD @ 1.7472 TP +20 pips

Buy EUR/USD @ 1.2080 TP +20 pips

Buy EUR/USD @ 1.2080 TP +20 pips


GBP/USD went down in the begenning of the Asian session , grabbing the few +20 pips recommended in yesterday's trades. Now the pair turned to form a bullish candle and tomorrow is expected to break today's high by at least +15 pips.


EUR/USD went down in a bearish movement at the begening of the asian session of trading, grabing +20-+30 pips that I recommended in yesterday's post, now the pair has formed what is called a spinning bottom, and a bullish bar is awaiting tomorrow's trading sessions as I predict.


EUR/USD went down in a bearish movement at the begening of the asian session of trading, grabing +20-+30 pips that I recommended in yesterday's post, now the pair has formed what is called a spinning bottom, and a bullish bar is awaiting tomorrow's trading sessions as I predict.


GBP/USD went down as a bearish bar breaking previous day's low as I indicated in the previous post getting +25 pips so far, I predict that it will be a more bearish day but orders were executed and TP was met so no more trades for today and see you tomorrow .


EUR/USD broke yesterday's low by about +28 pips until now, so orders were executed and at least +20 pips was captured here.

Saturday, July 23, 2005


GBP/USD failed to break above the 1.7618 high, probably because of the explosions threat that helped in the bearish movement of the GBP, now expect further bearish movement like in the case of the EUR/USD below, so my recommended trade is:
sell GBP/USD at current range for +20 pips profit.


Recommended trades: Sell EUR/USD at current price, take profit at +20pips.


EUR/USD reached the strong resistance at 1.2252 followed by sharp descent to a bearisg candle yesterday, I expect further bearish movement at least 20-25 pips below yesterday's Low

Thursday, July 21, 2005


Eur/USD bulls and bears are equally fighting now.


Eur/USD analysis:+ 45 pips so far from yesterday's close.


A bullsih candle was formed today after yesterday's hummber in the GBP/USD daily chart.

Wednesday, July 20, 2005


A hammer is formed yesterday in the daily candlestick chart of the GBP/USD , I expect that there will be a long bullish candle tomorrow on 21/07/2005, but I only expect :) lol


I am really starting to like analysing candle stick formations, the situation reminds me of what I read when I started learning this stick patterns, FX books said that you either love it and use it always or hate it and never use it again.


More bullish action is expected as of tomorrow, a hammer was seen on 19-07-2005 followed by a bullish candle and I expect the price to move in a bullish direction for 20-30 pips more.

Tuesday, July 19, 2005


EUR/USD Daily chart analysis.


Sell orders at Oanda indicates that a large proportion of traders and placing orders above the current price, and this confirms with the idea that the EUR/USD will make some upward movement for today before resuming its downward movement.


Open trades at Oanda indicates Euro/Usd will have some touches with the resistance levels today. Eur/USD fell 50-60 pips today and there may be some retracement I think before continuing some downward movement.

EUR/USD went down as predicted in the last post

EUR/USD went down as predicted in the last post, It went down about 50-60 pips.

Monday, July 18, 2005


Eur?USD is going down.