Tuesday, August 16, 2005

shooting star in the USD/CHF daily chart


Typical shooting star in the USD/CHF daily chart indicating a bearish day may follow.

Hammer formation in the EUR/USD daily chart.


A long bearish candle transformed to a long hammer, indicating the probability that tomorrow will be a Euro bulls day. Buy order triggered on prices breaking 1.2371 for +10 pips to +50 pips or according to your exit strategy. Please note that I always close my oredrs after a minimal amount of pips regardless which pattern I see in the candlestick charts.
I am using metatrader 4 platform because I get a lot of questions in this issue, I am on +2 GMT time frame which is the default time frame in the Metatrader 4 application.Metatrade 4 can be downloaded for free from http://www.metaquotes.net/.

The Good News Part 1

I walked into the religious instruction classroom in a secular school and, with tongue-in-cheek, wrote in large letters across the blackboard "I hate religion."
"Man, in this class, you'll get shot," gasped one student in amazement.
"But I'm sold on real Christianity," I responded.
"What's the difference?" half the class chorused.

God's Purpose

The point is one can be religious without necessarily being Christian. Let me explain. True, Christianity is a religion, but it's much more than that. It's also much more than believing a creed. It's a relationship with God and people. It's knowing God personally, experiencing His divine love and forgiveness, and communicating this to every life we touch.

We start by realizing that no matter what we have ever done or have failed to do, God loves us and is vitally interested in our total life--both for this life as well as the next. In fact, Jesus said, "For God so loved the world that He gave His one and only Son, that whoever believes in Him shall not perish but have eternal life" (John 3:16). And again, "I came that they may have life, and have it to the full" (John 10:10).
 
To be continued.


Comments are always welcomed

Hi all, I would really love to see your comments and analysis and ideas on my posts so please just click on the comment link and share your analysis. I always try to reply every comment.
Good luck to you all and May Jesus bless.

Shaven head in the GBP/USD daily chart confirmed


Bear candle as suggested in the previous post confirming the bearish short term pattern in the cable.

Tweezer top formation in the EUR/USD weekly chart


Tweezer top formation in the EUR/USD weekly chart, This will trigger a sell signal on breaking 1.2314 level.

Daily Bible Verse

"You are the salt of the earth. But if the salt loses its saltiness, how can it be made salty again? It is no longer good for anything, except to be thrown out and trampled by men."
                      Matthew 5:13  (NIV)

Monday, August 15, 2005

British Pound/US Dollar From SaxoBank.com

British Pound/US Dollar     
GBPUSD  (1.8095 @ 22:53 GMT)
Cable should continue to consolidate from the recent highs early this week and we look for a short term target of 1.8010, with a break of 1.8175 minimally required to change the current downside bias and will likely give scope to a test of 1.8240 50% retracement 1.9220-1.7260. Support/Resistance 1.7860/1.8010/1.8072.  - 1.8150/1.8175/1.8240.

Shaven head in the GBP/USD daily chart


Shaven head in the GBP/USD daily chart, a bearish candle may follow tomorrow. Watch for the U.K. Economic calender release and get ready to go bearish.

Shaven Head


Pattern :- A candlestick with no upper wick.
Interpretation:- A bullish pattern during a downtrend and a bearish pattern during an uptrend.

Daily Bible Verse

If any of you lacks wisdom, he should ask God, who gives generously to all without finding fault, and it will be given to him.
James 1:5 (NIV)

Daily Quote

The greatest mistake you can make in life is to be continually fearing you will make one.

Elbert Hubbard

USD/CHF daily chart


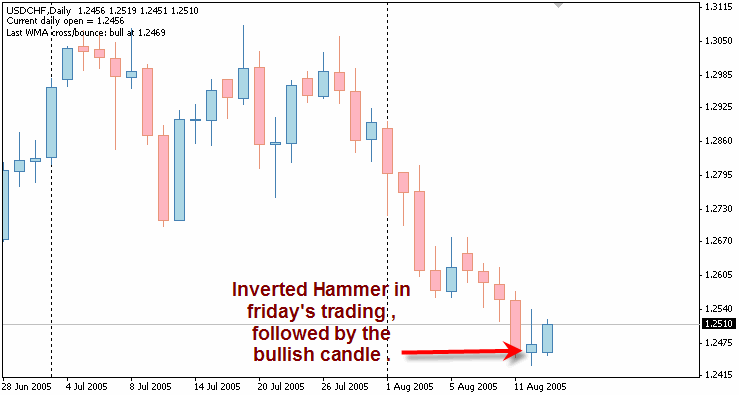
Actual bullish bar that is formed today compared to the suggested one in the previous post

Inverted hammer in the USD/CHF confirmed

Inverted Hammer in Friday's trading day, Now confirmed and followed a long bullish candle.

Hanging man confirmed in the EUR/USD chart


It was a hanging man , and a long bear candle met today's trading for the EUR/USD pair.

Saturday, August 13, 2005

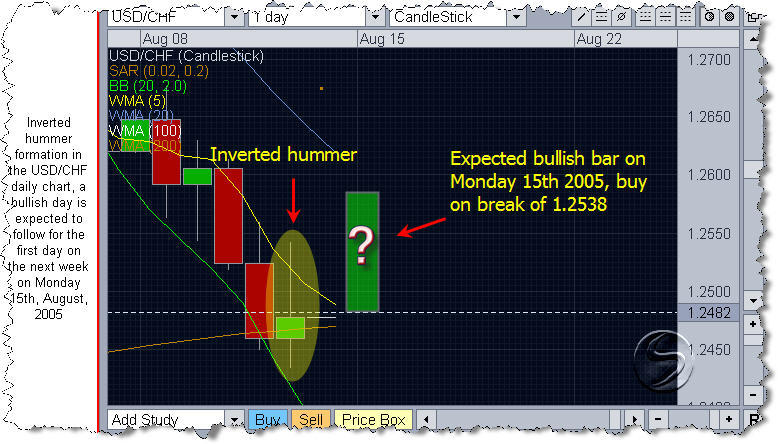
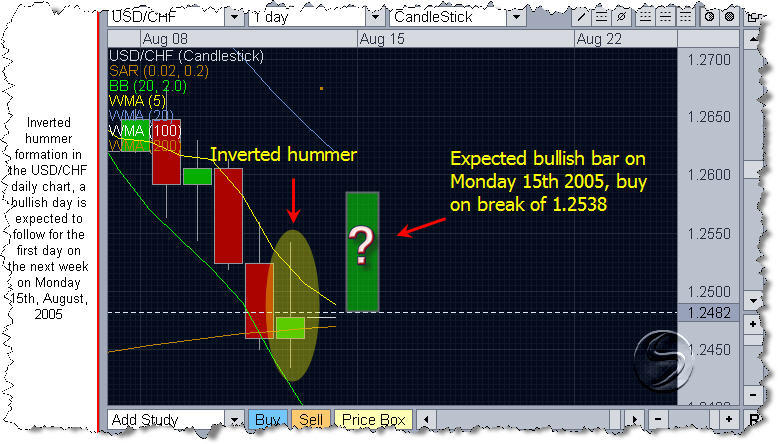
Inverted hummer formation in the USD/CHF daily chart


Inverted hummer formation in the USD/CHF daily chart, a bullish day is expected to follow for the first day on the next week on Monday 15th, August, 2005


Expected bullish bar on Monday 15th 2005, buy on break of 1.2538

Inverted Hammer


A small real body at the lower end of a long upper shadow. It warns of a potential bottom reversal in a falling market.

Hanging man formation in the EUR/USD daily chart


Hanging man formation in the EUR/USD daily chart, a bearish day is expected to follow on Monday 15th August when the market opens.

Hammer and Hanging Man in Candlesticks formations patterns


The first pair, hammer and hanging man, are identical with small bodies and long lower shadows. The second pair, shooting star and inverted hammer, are also identical with small bodies and long upper shadows. Only preceding price action and further confirmation determine the bullish or bearish nature of these candlesticks. The hammer and inverted hammer form after a decline and are bullish reversal patterns, while the shooting star and hanging man form after an advance and are bearish reversal patterns.

The hammer and hanging man look exactly alike, but have different implications based on the preceding price action. Both have small real bodies (black or white), long lower shadows and short or non-existent upper shadows. As with most single and double candlestick formations, the hammer and hanging man require confirmation before action.

The hammer is a bullish reversal pattern that forms after a decline. In addition to a potential trend reversal, hammers can mark bottoms or support levels. After a decline, hammers signal a bullish revival. The low of the long lower shadow implies that sellers drove prices lower during the session. However, the strong finish indicates that buyers regained their footing to end the session on a strong note. While this may seem enough to act on, hammers require further bullish confirmation. The low of the hammer shows that plenty of sellers remain. Further buying pressure, and preferably on expanding volume, is needed before acting. Such confirmation could come from a gap up or long white candlestick. Hammers are similar to selling climaxes and heavy volume can serve to reinforce the validity of the reversal.

The hanging man is a bearish reversal pattern that can also mark a top or resistance level. Forming after an advance, a hanging man signals that selling pressure is starting to increase. The low of the long lower shadow confirms that sellers pushed prices lower during the session. Even though the bulls regained their footing and drove prices higher by the finish, the appearance of selling pressure raises the yellow flag. As with the hammer, a hanging man requires bearish confirmation before action. Such confirmation can come as a gap down or long black candlestick on heavy volume.

Tuesday, August 09, 2005


Hummer formation here, buy on break of 1.2626 for 10-50 pips profit, depending upon your exit strategy.