Sunday, October 09, 2005

EUR/USD daily update


The EUR/USD met a strong resistance in the daily chart, and couldnot break the 1.2201 level, instead it went down to test the 1.2100 level again, now focus on the 1.2201 support if broken then a chance that the EUR/USD will go downward is more likely.

Thursday, September 01, 2005

Sorry for stopping my analysis

Hi everyone, I am so sorry that I have stopped my analysis for the forex candlestick charts, I don't know exactly when I am gonna resume it because I am so busy now, but I promise it will be in the near future.
May Jesus bless you.

Wednesday, August 24, 2005

Sorry for not posting my candlestick analysis

Hi, I am so sorry for the delay n posting my candlestick analysis, but
I am very busy this week, and if God's will I will restart posting my
analysis after a week.
May Jesus Christ bless you all.

SaxoBank Analysis 24 th August 200505:10 GMT

Euro/US Dollar     

EURUSD  (1.2178 @ 05:17 GMT)
EUR/USD attempted to rally again late yesterday, possibly on weakness in US equity markets. But overnight, the stronger USD and saw 1.2195 area support fall, and now we focus on 1.2130 as the last support holding the pair back from a retest of the 1.2000 area. 1.2195 is now resistance. Further out, we may look for EUR to find strong support.  
Resist.
1.2356
1.2291
1.2263
1.2178
1.2199
1.2162
1.2098
Support

British Pound/US Dollar     

GBPUSD  (1.7923 @ 05:19 GMT)
GBP/USD looks like it is finally committing lower, with a fall through 1.7900 further confirming that we should focus on 1.7800 now and possibly even 1.7500 eventually. 1.7970 is first resistance, followed by the 1.8020 area.  
Resist.
1.8120
1.8060
1.8039
1.7923
1.7979
1.7940
1.7880
Support

US Dollar/Japanese Yen     

USDJPY  (110.61 @ 05:34 GMT)
USD/JPY rallied strongly overnight, possibly for technical reasons as the 110.15 minor resistance was taken out. Still, 110.80 is an awfully big barrier. If the pair can pull through that level, then we're looking at the range between 111.50 and 113 again. To the downside, 110.00 looks like a swing level.  
Resist.
111.06
110.47
110.17
110.61
109.58
109.29
108.70
Support

Tuesday, August 23, 2005

Saxo Analysis 23 August 2005

Euro/US Dollar     

EURUSD  (1.2213 @ 12:46 GMT)
EUR/USD found resistance below the 1.2260 ideal resistance area, though a positive boost from Germany and EuroZone sentiment surveys still presents a risk that the pair could revisit the 1.2300 area before heading lower again. Support appears robust around the 1.2200 area for now.  
Resist.
1.2386
1.2297
1.2263
1.2213
1.2174
1.2120
1.2032
Support

British Pound/US Dollar     

GBPUSD  (1.7965 @ 12:46 GMT)
GBP/USD can't make up its mind which way it wants to go, but the preference is for it to eventually head lower, especially if it stays below yesterday's high and the resistance at 1.8047. A move through 1.7900 encourages the view toward 1.7800 and possibly even 1.7500 eventually.  
Resist.
1.8228
1.8111
1.8055
1.7965
1.7937
1.7875
1.7757
Support

US Dollar/Japanese Yen     

USDJPY  (110.14 @ 12:46 GMT)
USD/JPY still looks heavy, and a fall through 109.50 again could encourage a test of the crucial 108.90 area, which guards the gates to much lower levels still. The upside swing level comes in around 110.00 - this was briefly breached this morning, but must hold if it is to help swing the pair higher. 110.80 is the key resistance higher still.  
Resist.
112.21
111.06
110.42
110.14
109.28
108.77
107.63
Support

Tuesday, 23rd August 2005 SaxoBank Analysis

Euro/US Dollar     

EURUSD  (1.2204 @ 05:53 GMT)
EUR/USD found resistance below the 1.2260 ideal resistance area, though a positive boost from Germany and EuroZone sentiment surveys still presents a risk that the pair could revisit the 1.2300 area before heading lower again. Support appears robust around the 1.2200 area for now.  
Resist.
1.2386
1.2297
1.2263
1.2204
1.2174
1.2120
1.2032
Support

British Pound/US Dollar     

GBPUSD  (1.7978 @ 05:55 GMT)
GBP/USD can't make up its mind which way it wants to go, but the preference is for it to eventually head lower, especially if it stays below yesterday's high and the resistance at 1.8047. A move through 1.7900 encourages the view toward 1.7800 and possibly even 1.7500 eventually.  
Resist.
1.8228
1.8111
1.8055
1.7978
1.7937
1.7875
1.7757
Support

US Dollar/Japanese Yen     

USDJPY  (109.96 @ 05:58 GMT)
USD/JPY still looks heavy, and a fall through 109.50 again could encourage a test of the crucial 108.90 area, which guards the gates to much lower levels still. The upside swing level comes in around 110.00 - this was briefly breached this morning, but must hold if it is to help swing the pair higher. 110.80 is the key resistance higher still.  
Resist.
112.21
111.06
110.42
109.96
109.28
108.77
107.63
Support

Monday, August 22, 2005

Rich disciples

The Burial of Jesus
    57.  As evening approached, there came a rich man from Arimathea, named Joseph, who had himself become a disciple of Jesus.
                                                       Matthew 27:57

Oanda Spreads


Oanda Spreads: This morning I woke up to see Oanda spreads on the EUR/USD 0.9.
WOW Good Job Oanda

Sunday, August 21, 2005

GBP/USD weekly chart analysis


GBP/USD showing a similar story to the EUR/USD weekly chart, apparent Tweezer top is seen which indicate further bearish movement for this week as well.

EUR/USD weekly chart analysis

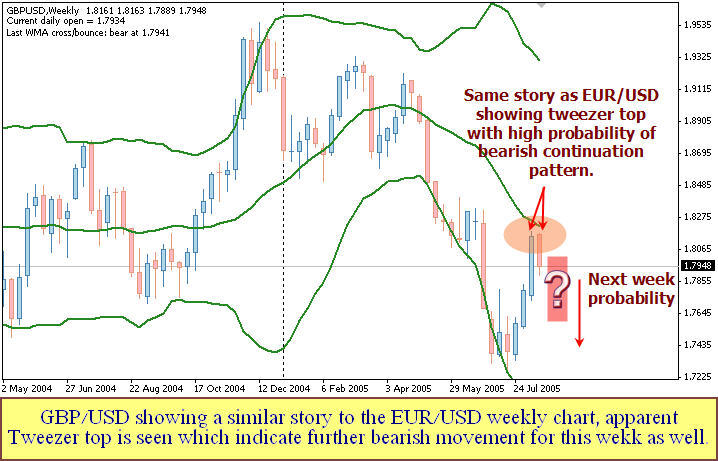
EUR/USD weekly chart showing tweezer top, indicating a possible bearish continuation pattern, but beware of possible bullish Monday as a normal start of the candle.

Thursday, August 18, 2005

Daily Bible Verse

The tongue that brings healing is a tree of life, but a deceitful tongue crushes the spirit.
Proverbs 15:4  (NIV)

The Good news Part 3

Christ's Answer

Because our sin has separated us from God, we have been left with a "God-shaped vacuum" or spiritual emptiness. The world's many religions are all evidence of mankind's endless struggle to fill this vacuum. And our relentless search for inner peace through pleasure seeking, power, fame, fortune, drugs, and mystical experiences all tell of our inner emptiness.

As it is impossible for us to find God or peace with Him through our own efforts, God in His love and mercy sent His own sinless Son, Jesus Christ, to save us from our predicament ( Ephesians 2:8-9).

Christ did this by dying on the cross in our place to pay the ransom price for our sins--which was death (I Timothy 2:5-6). Thus Jesus Christ is God's only provision for our sin and He is the only way back to God and eternal life ( John 14:6 and Romans 5:8).

Site stats


The site exceeded more than 5000 visitors, i hope all of you had some help from this blog. May God bless you all

Inverted hammer formation in the EUR/JPY daily candle


Inverted Hammer formation in the daily chart of the EUR/JPY pair indicating a probability of short term bearish reversal. Prices are epected to go bullish tomorrow if broken the 135.45 range.

Eur/Usd analysis for 18th August 2005


Short term bearish movement in the Eur/Usd is expected to continue if the prices broke the yesterday's low of 1.2156, set your TP tight because it is the end of the week and prices may retrace a bit before closing the weekly candle.

GBP/USD analysis for 18th August 2005


GBP/USD finally broke the 1.8000 psychological support and important one too, all the forecasts from other brokers expect the breakdown to continue to 1.7800, anyways long bearish bar is expected to follow tomorrow as well but beware of the end of the week where prices may retrace a bit.

Short term bearish movement confirmed in the cable

The Cable broke the 1.8017 support and reching the 1.7961 level, confirming the short term bearish movement of the GBP/USD.

Wednesday, August 17, 2005

GBP/USD Analysis for tomorrow


Short term trend in the cable is bearish. Further bearish movement is expected as of tomorrow if the 1.8017 is broken.

Weekly chart of the EUR/USD


Weekly chart of the EUR/USD showing short term bearish movement, but again pay strong attention to the 1.2250 level.

Eur/Usd analysis for tomorrow


EUR/USD went the other way which I didn't expect, now further movement is expected in the bearish side. Set you sell orders at breaking the 1.2260 level, but beware of the strong support at 1.2250. so you may see reversal at 1.2250.

The Good News .....Part 2

Man's Problem

Unfortunately, it is our wrongdoing or sin that blocks out our experiencing God's love and receiving the full and abundant life that He has for us. And let's face it, "We have all sinned and fallen short of God's standard" (Romans 3:23). Sin, of course, is not merely doing wrongful acts. It is anything that falls short of the perfection that God envisioned for us--including our damaged emotions, negative attitudes, and mixed motives.

Punishment for sin comes from the wrongdoing itself. Sin has its own self destructive consequences--first spiritual death and ultimately eternal death (Romans 6:23); that is eternal separation from God, the Author of all love and life.

EUR/USD moved exactly the opposite of what i suggested


EUR/USD moved exactly the opposite of what i suggested and It was definitely not a hammer, but my orders to buy at 1.2371 was not executed, and the same story happened with the USD/CHF.

Daily bible verse

Fear not, for I am with you; be not dismayed, for I am your God. I will
strengthen you, yes, I will help you, I will uphold you with My righteous
right hand. - Isaiah 41:10.

About the Bible verses in this blog

If you have a knife, you can either use it to cut an apply into pieces and so you would have your lunch or you would use it to cut a human being into pieces and you would be called a murderer.
I think the story is pretty much the same for the forex, you may be called a gambler if you just entered with all the money you have and with no analysis trying to pick 200 pips in one day. but with decent money management and with good risk reward ratio then you are not different from anyone opening a supermarket and trying to sell and buy some tomatoes to earn his living.
SO I DON'T THINK THAT POSTING SOME BIBLE VERSES HERE WOULD BE A MISTAKE SIMPLY BECAUSE I DON'T THINK TRADING IN THE FOREX IS A MISTAKE.
For all the people who insulted me in emails and who insulted me in the comments here, I would tell them that I will complete posting in this blog bible verses, and if anyone thinks it is blasphemous then please don't visit the blog.
Thanks as well for all those who comments about my forex analysis.
May Jesus bless you all.

Orders were not executed and my analysis yesterday was wrong.

Hi all, I completely analysed yesterday's EUR/USD and USD/CHF in a wrong way,  it was too early to say that this was a reversal in pattern because simply there wasn't enough days of the original pattern, but orders were not exceuted since I mentioned that buying orders in the EUR/USD only when breaking yesterday's High at 1.2371 which didn't happen "Thanks God for that"

Tuesday, August 16, 2005

shooting star in the USD/CHF daily chart


Typical shooting star in the USD/CHF daily chart indicating a bearish day may follow.

Hammer formation in the EUR/USD daily chart.


A long bearish candle transformed to a long hammer, indicating the probability that tomorrow will be a Euro bulls day. Buy order triggered on prices breaking 1.2371 for +10 pips to +50 pips or according to your exit strategy. Please note that I always close my oredrs after a minimal amount of pips regardless which pattern I see in the candlestick charts.
I am using metatrader 4 platform because I get a lot of questions in this issue, I am on +2 GMT time frame which is the default time frame in the Metatrader 4 application.Metatrade 4 can be downloaded for free from http://www.metaquotes.net/.

The Good News Part 1

I walked into the religious instruction classroom in a secular school and, with tongue-in-cheek, wrote in large letters across the blackboard "I hate religion."
"Man, in this class, you'll get shot," gasped one student in amazement.
"But I'm sold on real Christianity," I responded.
"What's the difference?" half the class chorused.

God's Purpose

The point is one can be religious without necessarily being Christian. Let me explain. True, Christianity is a religion, but it's much more than that. It's also much more than believing a creed. It's a relationship with God and people. It's knowing God personally, experiencing His divine love and forgiveness, and communicating this to every life we touch.

We start by realizing that no matter what we have ever done or have failed to do, God loves us and is vitally interested in our total life--both for this life as well as the next. In fact, Jesus said, "For God so loved the world that He gave His one and only Son, that whoever believes in Him shall not perish but have eternal life" (John 3:16). And again, "I came that they may have life, and have it to the full" (John 10:10).
 
To be continued.


Comments are always welcomed

Hi all, I would really love to see your comments and analysis and ideas on my posts so please just click on the comment link and share your analysis. I always try to reply every comment.
Good luck to you all and May Jesus bless.

Shaven head in the GBP/USD daily chart confirmed


Bear candle as suggested in the previous post confirming the bearish short term pattern in the cable.

Tweezer top formation in the EUR/USD weekly chart


Tweezer top formation in the EUR/USD weekly chart, This will trigger a sell signal on breaking 1.2314 level.

Daily Bible Verse

"You are the salt of the earth. But if the salt loses its saltiness, how can it be made salty again? It is no longer good for anything, except to be thrown out and trampled by men."
                      Matthew 5:13  (NIV)

Monday, August 15, 2005

British Pound/US Dollar From SaxoBank.com

British Pound/US Dollar     
GBPUSD  (1.8095 @ 22:53 GMT)
Cable should continue to consolidate from the recent highs early this week and we look for a short term target of 1.8010, with a break of 1.8175 minimally required to change the current downside bias and will likely give scope to a test of 1.8240 50% retracement 1.9220-1.7260. Support/Resistance 1.7860/1.8010/1.8072.  - 1.8150/1.8175/1.8240.

Shaven head in the GBP/USD daily chart


Shaven head in the GBP/USD daily chart, a bearish candle may follow tomorrow. Watch for the U.K. Economic calender release and get ready to go bearish.

Shaven Head


Pattern :- A candlestick with no upper wick.
Interpretation:- A bullish pattern during a downtrend and a bearish pattern during an uptrend.

Daily Bible Verse

If any of you lacks wisdom, he should ask God, who gives generously to all without finding fault, and it will be given to him.
James 1:5 (NIV)

Daily Quote

The greatest mistake you can make in life is to be continually fearing you will make one.

Elbert Hubbard

USD/CHF daily chart


Actual bullish bar that is formed today compared to the suggested one in the previous post

Inverted hammer in the USD/CHF confirmed

Inverted Hammer in Friday's trading day, Now confirmed and followed a long bullish candle.

Hanging man confirmed in the EUR/USD chart


It was a hanging man , and a long bear candle met today's trading for the EUR/USD pair.

Saturday, August 13, 2005

Inverted hummer formation in the USD/CHF daily chart


Inverted hummer formation in the USD/CHF daily chart, a bullish day is expected to follow for the first day on the next week on Monday 15th, August, 2005


Expected bullish bar on Monday 15th 2005, buy on break of 1.2538

Inverted Hammer


A small real body at the lower end of a long upper shadow. It warns of a potential bottom reversal in a falling market.

Hanging man formation in the EUR/USD daily chart


Hanging man formation in the EUR/USD daily chart, a bearish day is expected to follow on Monday 15th August when the market opens.

Hammer and Hanging Man in Candlesticks formations patterns


The first pair, hammer and hanging man, are identical with small bodies and long lower shadows. The second pair, shooting star and inverted hammer, are also identical with small bodies and long upper shadows. Only preceding price action and further confirmation determine the bullish or bearish nature of these candlesticks. The hammer and inverted hammer form after a decline and are bullish reversal patterns, while the shooting star and hanging man form after an advance and are bearish reversal patterns.

The hammer and hanging man look exactly alike, but have different implications based on the preceding price action. Both have small real bodies (black or white), long lower shadows and short or non-existent upper shadows. As with most single and double candlestick formations, the hammer and hanging man require confirmation before action.

The hammer is a bullish reversal pattern that forms after a decline. In addition to a potential trend reversal, hammers can mark bottoms or support levels. After a decline, hammers signal a bullish revival. The low of the long lower shadow implies that sellers drove prices lower during the session. However, the strong finish indicates that buyers regained their footing to end the session on a strong note. While this may seem enough to act on, hammers require further bullish confirmation. The low of the hammer shows that plenty of sellers remain. Further buying pressure, and preferably on expanding volume, is needed before acting. Such confirmation could come from a gap up or long white candlestick. Hammers are similar to selling climaxes and heavy volume can serve to reinforce the validity of the reversal.

The hanging man is a bearish reversal pattern that can also mark a top or resistance level. Forming after an advance, a hanging man signals that selling pressure is starting to increase. The low of the long lower shadow confirms that sellers pushed prices lower during the session. Even though the bulls regained their footing and drove prices higher by the finish, the appearance of selling pressure raises the yellow flag. As with the hammer, a hanging man requires bearish confirmation before action. Such confirmation can come as a gap down or long black candlestick on heavy volume.

Tuesday, August 09, 2005


Hummer formation here, buy on break of 1.2626 for 10-50 pips profit, depending upon your exit strategy.

Thursday, August 04, 2005


EUR/USD broke the 1.2343 level shooting up to 1.2380 level, triggering the order at 1.2343 and getting 37 pips there, of course I just got a few of these pips :) but lucky who got more.

Wednesday, August 03, 2005


EUR/USD broke the 1.2171 support today reaching 1.2146, then it went up like a rocket to break the 1.2250 resistance which was the powerfull resistance he didn't break easily, but after that the EUR/USD reached 1.2343. Orders at this level for buying EUR/USD @ 1.2343 for a 10-20 pips profit.


The EUR/USD descended down to 1.2150 in the Asian session as was predicted in the previous post, collecting about from 20-50 ips depending about exit strategies. Now the pair mey a strong support at 1.2150 reversing the direction to reach 1.2206 at the time I am writing this comment. Oanda FxTrade platform is at 12.00EST, so everyday starts at 12.00 EST, (-7 GMT)


GBP/USD order was executed at 1.7670 for +10 pips profit although the pair extended the bearish movement to 1.7651, Now the pair met a strong support there as what happened in the EUR/USD pair.

Tuesday, August 02, 2005


Double top sign, which is a trend reversal sign in the EUR/USD daily chart. Sell at 1.2171 for 20-50 pips profit. For brave traders out there, you can sell from now for a 50 pips profit.


Sorry for the spelling mistakes, The correction is : Possible spining top on the GBP/USD daily chart at Oanda FXtrade platform. I think tomorrow is facing a bearish day for the GBP and it will be confirmed after the GBP interest rate announcement. Look for selling at 1.7670 for 10-30 pips profit.


Possible spining top on the GBP/USD daily chart at Oanda FXtrade platform. I think tomorrow is faccing a bearisg day for the GBP and it will be confirmed after the GBP interest rate announcement. Look for selling at 1.7670 for 10-30 pips profit.


A hammer is formed on the CHF/USD daily chart at Oanda FXtrade platfoirm, which adds to the confirmation that tomorrow will be a USD bulls day, look for buy at 1.2801 for 20-50 pips profit depending upon your exit strategy.

The EUR/USD failed to break the 1.2250 again!


The Eur/$ pair failed to break the 1.2250 again, will it break it in the next few days?

Monday, August 01, 2005

EUR/USD didn't break the 1.2250 resistance level today.


EUR failed to break the 1.2250 today, if the price moved lower today in the bears side, then a shooting star will be formed paving the way for a further down movement of the EURO.

Open Trades at Oanda as of 11.30 EST


Open Trades in Oanda as of 11.30 Est, prices may face some more retracement during the remaining hours of this day.

EUR/USD did make a retrace for 60 pips.

In my previous post today , 20-30 pips retracement in the EUR/USD was predicted, now the pair met a big retracement to 1.2181 level, triggering a sell signal on the bunny cross , but I am still out of the market for now.


3 Pip spread on GBP/USD pair, on Oanda FXtrade platform, Oanda never stops amazing me, I hope they settle this 3 pips spread as a premenant spread on this pair.


prices in the EUR/USD will retrace for while here , I predict it will retrace for about 20-30 pips.


prices in the EUR/USD will retrace for while here , I predict it will retrace for about 20-30 pips.


The EUR/USD did break the 1.2158 Hi level of the previous day, breaking with it the expectations of a stronger $ today, now the next resistance for the EUR/$ pair is 1.2250, if the Euro succeeded in breaking this level then further upmove is predicted.

Saturday, July 30, 2005

Economic Calender for Monday 1 August, 2005

Friday, July 29, 2005


Possible spinning top here, so look for a reversal if the EUR/USD didn't break the 1.2158 Hi for today

Thursday, July 28, 2005


Today was a reliefing day for the order which was executed two days ago and went down -100 pips, now today if anyone was having the guts , the order went to +120 pips, of course I didn't wait that long and I closed the trade at about +11 pips.


It was indeed a bullish engulfing pattern yesterday in the EUR/USD , Congratulation for all who gathered +20 pips and more.

Exit GBP/USD trade at +11 pips

Exit GBP/USD trade at +11 pips

Set your stop loss to 1.7474

Hi All the GBP/USD trade is now +15 ips, please set your stop loss to +0 pips @ 1.7474 and wait for te price to move.
Now any one can just close the trade when he think he got the pips that satisfy him, because the trade may turn against us and the net profit will be zero.
Have a nice time.

Wednesday, July 27, 2005

Bullish Engulfing Pattern


A chart pattern that forms when a small black candlestick is followed by a large white candlestick that completely eclipses or "engulfs" the previous day's candlestick. The shadows or tails of the small candlestick are short, which enables the body of the large candlestick to cover the entire candlestick from the previous day.


As implied in its name, this trend suggests that the bulls have taken control of a security’s price movement from the bears. This type of pattern usually accompanies a declining trend in a security, suggesting that a low or end to a security's decline has occurred. However, as usual in candlestick analysis, the trader must take the preceding and following days' prices into account before making any decisions regarding the security.

Is this a bullish engulfing pattern? I think so.

GBP/USD order placed yesterday

GBP/USD order placed yesterday is now at -8 pips instead of -100 pips. I will be watching the market to adjust exactly when to exit the trade. right now look for +20-+30 pips profit.

Tuesday, July 26, 2005


Unfortunately the order was made in the GBP/USD pair but the pair moved in the opposite direction quickly and stayed there all the day to end up with a bearish candle. I am still on the Long side in GBP/USD, -100 pips for now.